Project Brief
The average annual precipitation in a city of Xilinguolemeng Inner Mongolia is less than one-fourth of the national average annual precipitation which is a severe drought and water shortage area. Meanwhile, the city's main source of drinking water is groundwater where the content of fluoride, sulfate, and total hardness exceeds the national sanitary standards for drinking water. It can cause dental fluorosis, skeletal fluorosis, short stature, delayed growth of adolescents, and a series of problems endanger human health if drinking all the time. The quality of raw water for this project, please see below table 1.
Table 1. Quality Parameters of Groundwater
|
No. |
Item |
Analysis Value |
Unit |
|
No. |
Item |
Analysis Value |
Unit |
|
1 |
Chroma |
15.0 |
/ |
7 |
Sulfate |
360 |
mg/L |
|
|
2 |
Turbidity |
5.0 |
NTU |
8 |
Total Hardness |
580 |
mg/L |
|
|
3 |
Smell |
nil |
/ |
9 |
Chloride |
250 |
mg/L |
|
|
4 |
pH |
7.50 |
/ |
10 |
TDS |
1300 |
mg/L |
|
|
5 |
Nitrate |
8.50 |
mg/L |
11 |
Fluoride |
1.56 |
mg/L |
|
|
6 |
Manganese |
0.26 |
mg/L |
12 |
Total Iron |
0.42 |
mg/L |
In order to improve the quality of the city's water supply, raise the life quality of urban residents, and optimize the investment environment, it officially began to implement and transform the water purification project for the second and the new third water plant in April 2017 with a cumulative capacity of 30,000 tons per day .
Processing Diagram
In view of the high concentration TDS, total hardness, and sulfate etc. of local deep groundwater, it takes advanced "UF+RO double membrane method" pure physical deep core treatment process, supplemented by multi-media, self-cleaning filtration, precision filters and other pretreatment processes. The product water of the UF membrane system enters the RO desalination system, the RO product water is blended with the precision filter product water and then enters the finished product water pool, and is finally disinfected and sent to the pipeline network. The processing diagram is as below figure 1.
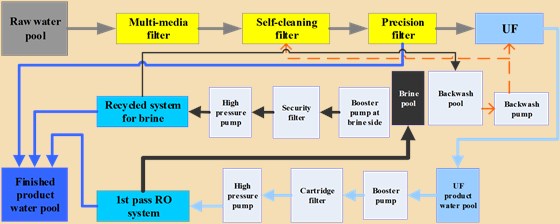
Figure 1. Project Processing Diagram
Operating Conditions
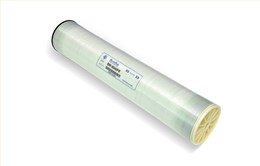
All the reverse osmosis skids of this project adopted the star product " fouling resistant reverse osmosis membrane element" of Keensen. Among them, there are 12 sets of 1st pass skids, totally 1,080pcs elements; 4 sets of 1st pass concentrated water treatment RO skids, totally 240pcs elements.
The project was
successfully put into operation in October 2017. The initial rejection rate of
the 1st pass RO system was >99.0%, and rejection rate of the concentrated
water treatment RO system was >98.7%.
All the other indicators also met the project design requirements. After nearly 3 years of running, the rejection rate and the permeate flow rate of the membrane system have remained stable. Among them, the reverse osmosis system of 1st pass has not yet been chemically cleaned, and the cleaning frequency of the concentrated water treatment RO system is once a year. The average operating data of RO skids is shown in the Table 2.
Table 2. Average historical operating data of the 1st pass concentrated water treatment RO system
|
Years |
Operating Pressure (bar) |
flow rate(m3/h) |
Recovery rate % |
TDS
(µs/cm) |
Rejection rate % |
skids |
Remarks |
||
|
Permeate water |
Concentrated water |
Permeate water |
Raw water |
|
|||||
|
2017 |
11.0 |
75 |
25 |
75.0 |
18.5 |
1942 |
99.1 |
1st pass system |
No chemical cleaning |
|
2018 |
11.2 |
75 |
23 |
76.5 |
20.0 |
1895 |
99.1 |
||
|
2019 |
11.5 |
74 |
24 |
75.5 |
18.0 |
1852 |
99.0 |
||
|
2020 |
12.0 |
73 |
24 |
75.2 |
20.0 |
1922 |
98.9 |
||
|
2017 |
10.5 |
43 |
42 |
50.0 |
51.2 |
4780 |
98.9 |
concentrated water Treatment System
|
Cleaning frequency Once a year |
|
2018 |
10.7 |
45 |
43 |
51.0 |
50.8 |
4685 |
98.5 |
||
|
2019 |
11.0 |
42 |
40 |
51.2 |
66.5 |
5126 |
98.7 |
||
|
2020 |
11.2 |
42 |
41 |
50.6 |
67.4 |
5189 |
98.6 |
||
从上表运行数据可得,经过近三年的连续运行,一级与浓水处理系
From the operating data
in the above table, after nearly 3 years of running,the
salt permeability of the 1st pass and concentrated water treatment system
still maintained at a low level, and the average annual salt permeability decay
rate is less than 7%;
the average annual
decay rate of permeate flow is about 3.5%, which is far lower than the
conventional standard.
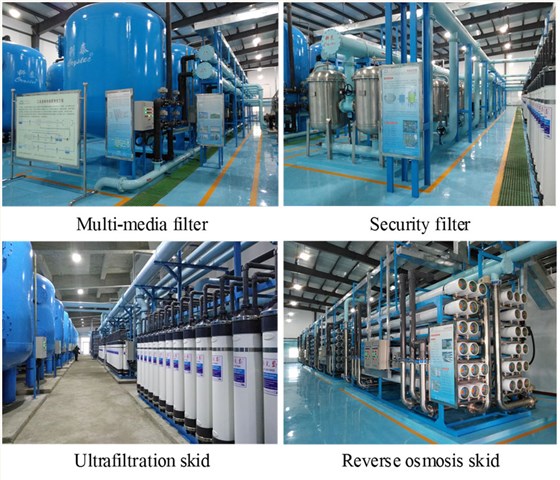
Figure 2. Field device diagram
Multi-media filterSecurity filter
Ultrafiltration skid Reverse osmosis skid
Summary
The total investment of
the project is about 80 million, and the daily water treatment capacity is
30,000 tons. The core filter skids all adopted Keensen "BW-8040FR" fouling resistant reverse osmosis membrane elements, which
fully realizes the products localization of this unit.
After 3 years of running, Keensen membranes have demonstrated excellent stability and have been highly recognized by customers.
KeenSen is not satisfied with current achievements,will keep going and create more value for partners with constantly innovative products and satisfactory services.

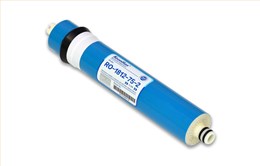 Residential Series RO Membrane Element
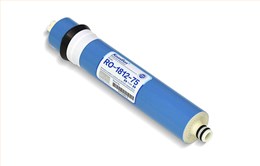 Residential Series RO Membrane Element
 Fouling Resistant RO Membrane Element
 Ultra-low Pressure RO Membrane Element